When to use it
Use it to write a semester plan before school starts, to align sections taught by different teachers, or to compare actual progress at midterm. Units, assessment and team work sit in three tracks, so you can read off which unit falls in which week and how many review days come before each exam.
Make it yours
- Replace the title and unit names with your course and scale the days to your lesson count.
- For holidays and school events, push the start date of the tasks that follow.
- If sections move at different speeds, copy the chart per section or give each its own track.
Mermaid code
semester-teaching-gantt.mmd
gantt
    title Grade 8 Math spring pacing guide
    dateFormat YYYY-MM-DD
    axisFormat %b %d
    todayMarker off
    section Units
    Unit 1 Exponents and roots :u1, 2027-01-11, 14d
    Unit 2 Pythagorean theorem :u2, after u1, 14d
    Unit 3 Linear equations :u3, after u2, 21d
    Unit 4 Functions :u4, 2027-03-15, 21d
    Unit 5 Data and statistics :u5, after u4, 14d
    section Assessment
    Unit 2 test :milestone, t1, after u2, 0d
    Midterm review :r1, after u3, 5d
    Midterm exam :milestone, t2, 2027-03-12, 0d
    Final review :r2, after u5, 14d
    Final exam :milestone, t3, 2027-05-21, 0d
    section Team
    Collaborative planning :j1, 2027-01-11, 7d
    Peer observation week :j2, 2027-02-15, 5d
    Semester reflection :j3, 2027-05-17, 5d
Ask an AI for one with this structure
Send the prompt below to ChatGPT or Claude, then paste the whole reply into the editor; the code inside is detected automatically.
prompt.txt
Draw a semester pacing guide with Mermaid gantt syntax. Use dateFormat YYYY-MM-DD and add todayMarker off. Create three sections: Units, Assessment and Team. Units lists five units in order linked with after. Assessment uses milestones for a unit test, the midterm exam and the final exam, and includes midterm review and final review. Team includes collaborative planning, a peer observation week and a semester reflection. Output only the mermaid code block.
FAQ
- Can the axis show weeks instead of dates?
Change
axisFormat %b %dtoaxisFormat Week %Wto show the week number of the year.- How do I show the number of lessons?
Write it in the task name, such as "Unit 1 Exponents and roots, 8 lessons".
- My school wants a table version.
Export Word and add a table under the chart. The Gantt chart works for presenting and posting, the table for records.
More in this category
 Project Schedule Gantt Chart Template
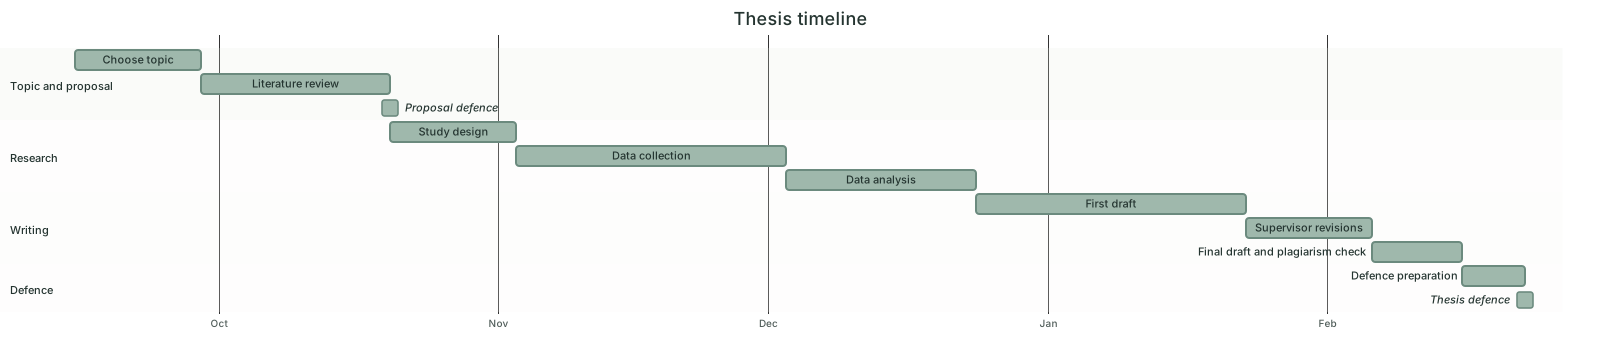 Thesis Timeline Gantt Chart Template
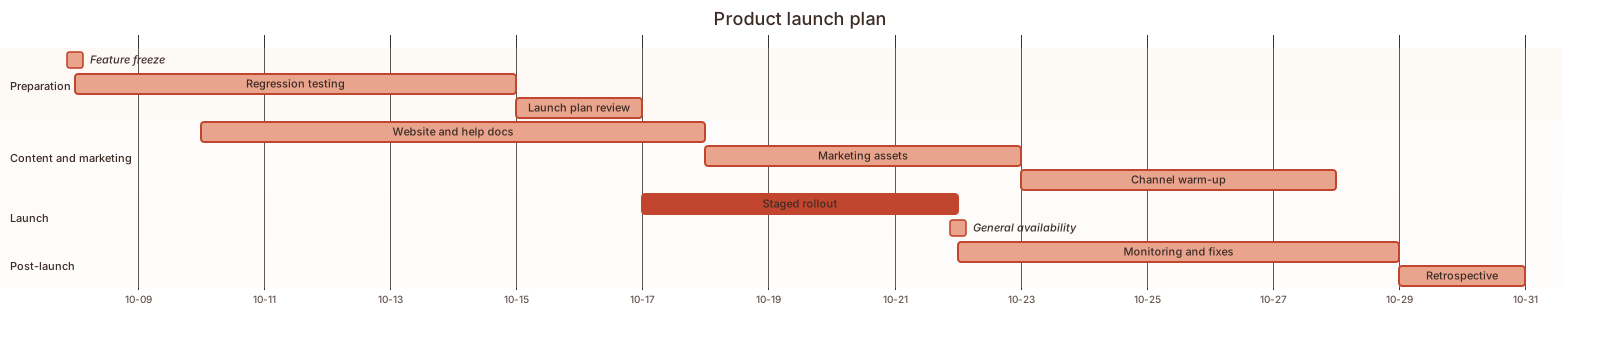 Product Launch Plan Gantt Chart Template
 Event Planning Gantt Chart Template
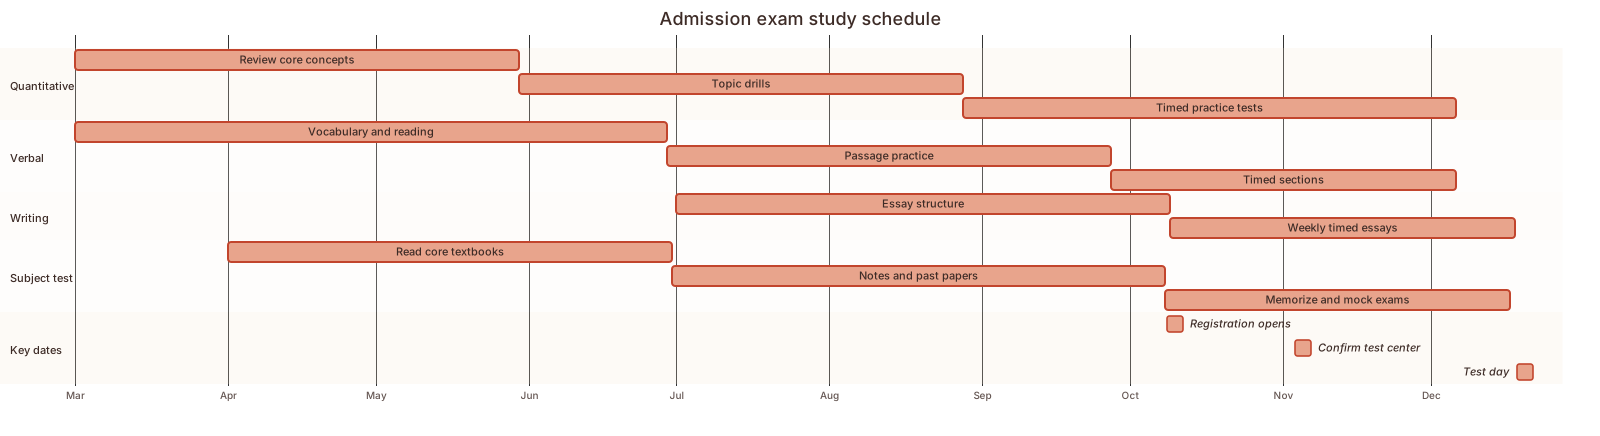 Exam study schedule Gantt chart template
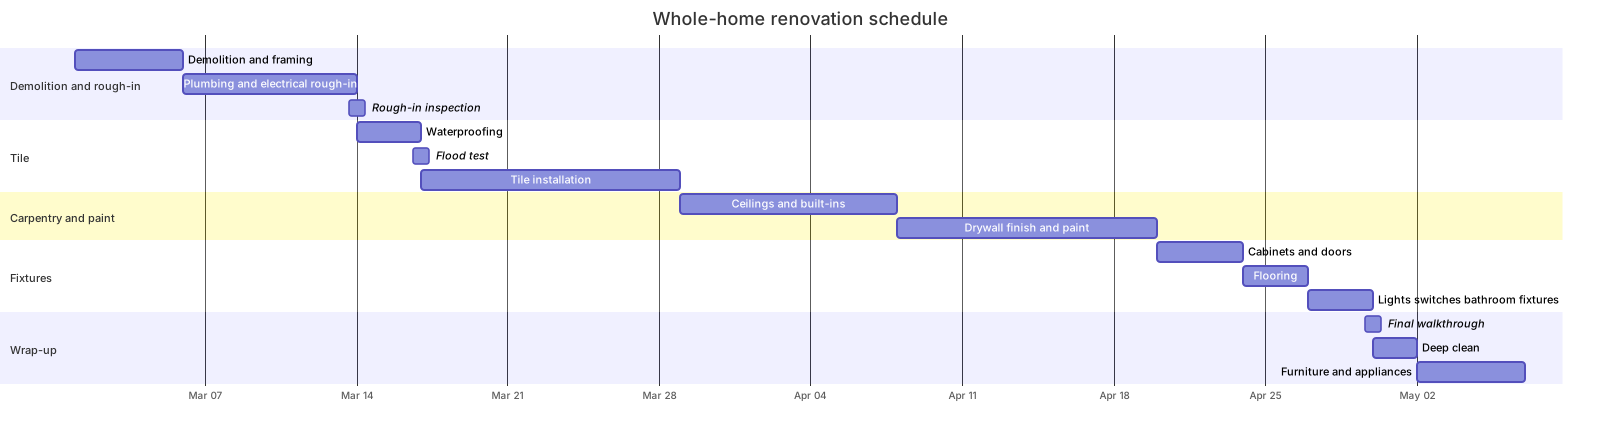 Home renovation schedule Gantt chart template
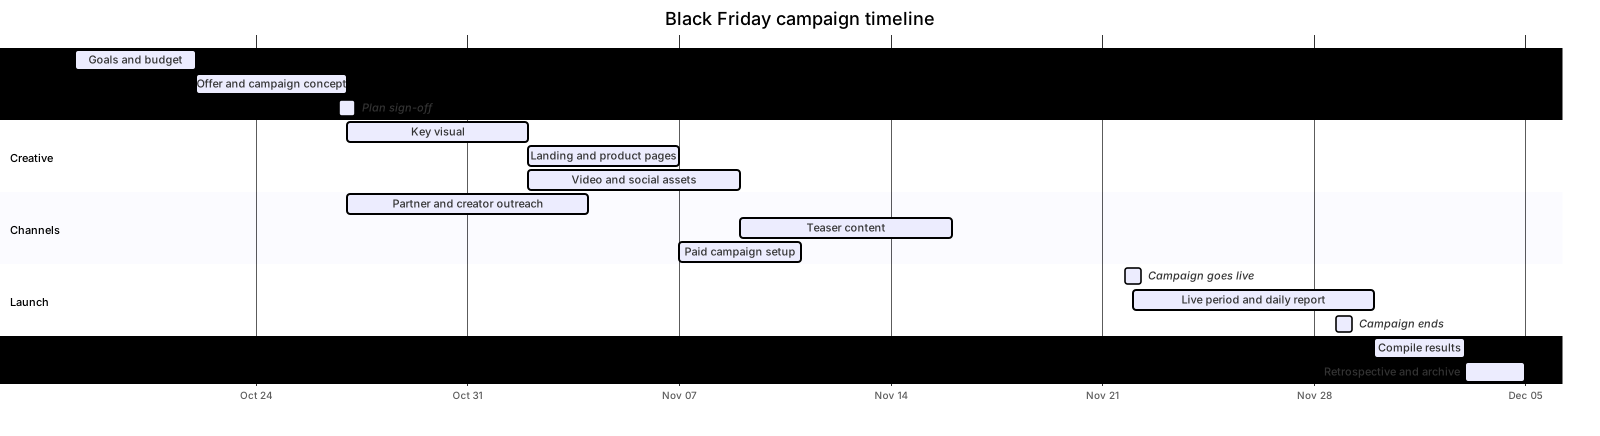 Marketing campaign timeline Gantt chart template
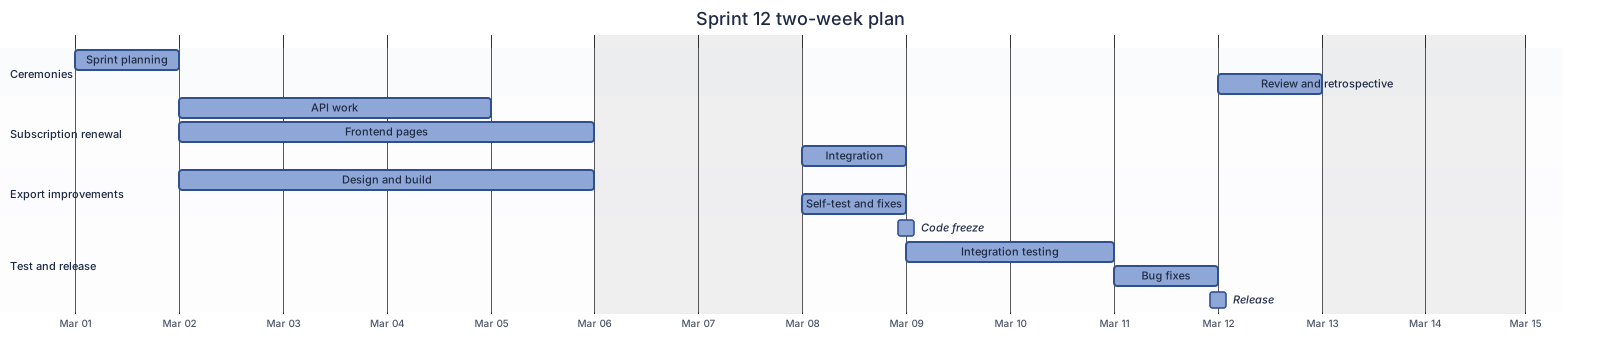 Two-week sprint plan Gantt chart template
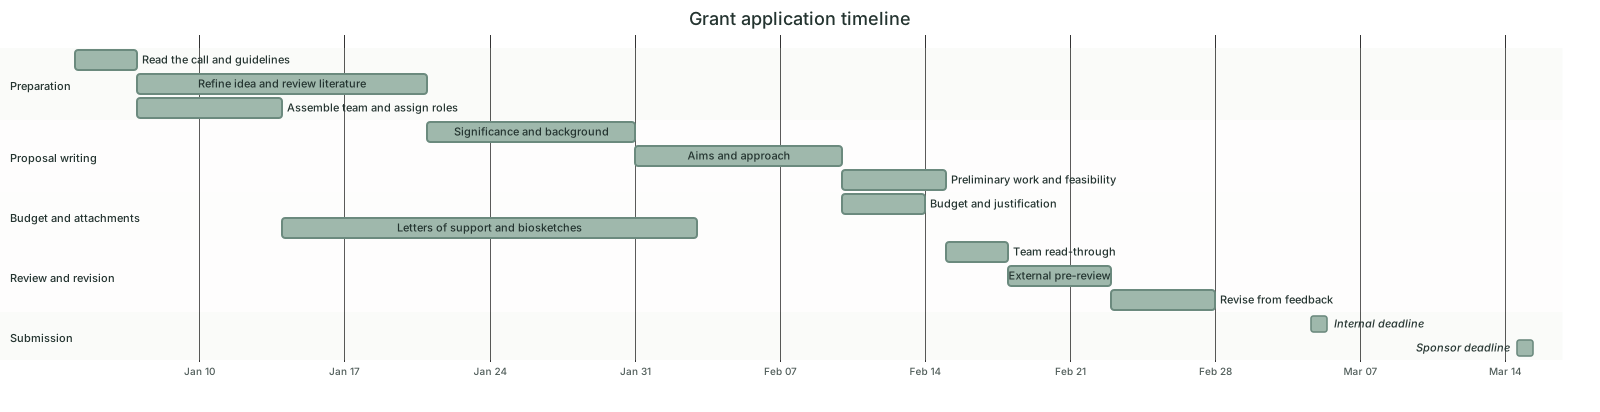 Grant application timeline Gantt chart template
Updated 2026-11-11