When to use it
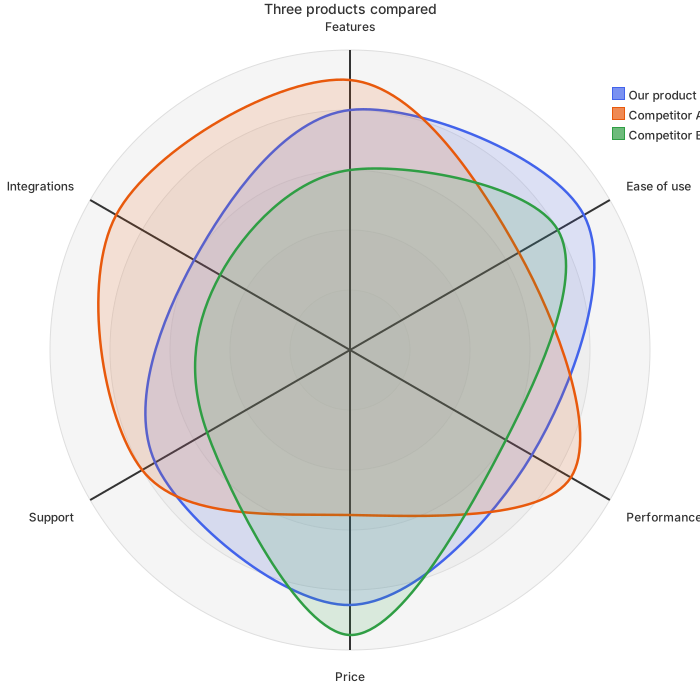
Use it to choose among candidate suppliers, for annual supplier reviews, or to present a recommendation to a sourcing committee. With three curves on one chart, who leads on quality and who wins on price is visible at once, which suits the first slide better than a score table does.
Make it yours
- Replace the supplier names and scores with the results from your scorecard.
- If criteria carry different weights, the radar shows raw scores; give the weighted total in a table.
- Beyond four suppliers the curves overlap, so shortlist to three first.
- Keep axis labels to one or two short words, because long labels are cut off at the edges.
- The count of numbers in braces must equal the number of criteria.
Mermaid code
radar-beta
    title Supplier evaluation
    axis a["Quality"], b["Price"], c["Delivery"], d["Service"], e["Technology"], f["Finances"]
    curve s1["Supplier A"]{5, 3, 4, 4, 5, 4}
    curve s2["Supplier B"]{4, 5, 3, 3, 3, 4}
    curve s3["Supplier C"]{3, 4, 5, 4, 3, 3}
    max 5
    min 0
Ask an AI for one with this structure
Send the prompt below to ChatGPT or Claude, then paste the whole reply into the editor; the code inside is detected automatically.
Draw a supplier evaluation radar chart with Mermaid radar-beta syntax. The title is Supplier evaluation, and the axes are Quality, Price, Delivery, Service, Technology and Finances. Add three curves, Supplier A, Supplier B and Supplier C, each with six scores from 0 to 5, plus max 5 and min 0. Output only the mermaid code block.
FAQ
- What does a high score on price mean?
A stronger position, which means a lower price scores higher. Score every criterion so that higher is better, or the chart is hard to read.
- Can I change the curve colors?
Colors follow the theme. Switching themes changes the palette, and the three curves always get distinct colors.
- Is there a chart for the qualification process?
Yes. The supplier qualification flowchart in the library pairs with this chart in a sourcing policy.
More in this category
Updated 2026-11-11