When to use it
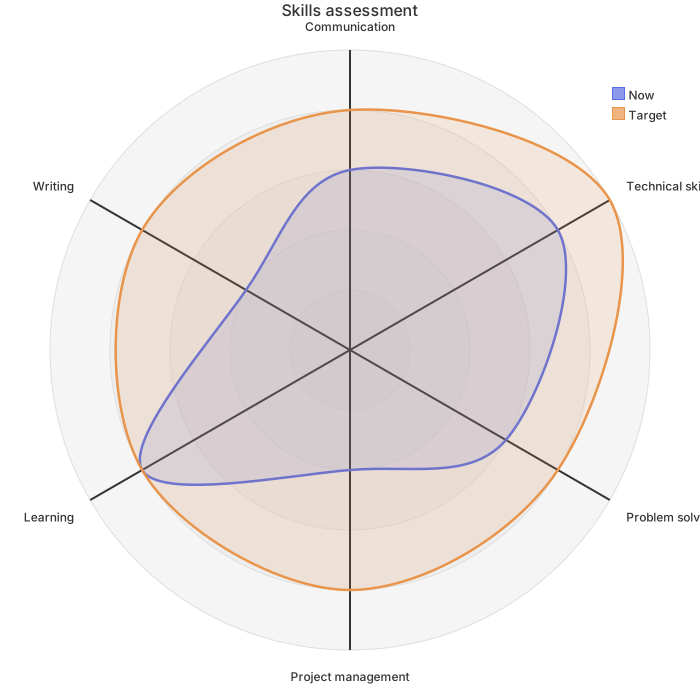
Competitive analysis, vendor selection reviews and product planning. Each product is one polygon. A larger area is not automatically better; look at who leads on the axes your users care about most.
Make it yours
- Change the
axisline to the dimensions you compare; turn "lower is better" measures such as price into a score first (cheaper scores higher). - Write one
curveline per product; the text in brackets is the legend label. - Back the scores with evidence where you can: feature checklist counts, measurements or survey results, and state the source in the report.
- With more than three products, split the comparison into two charts.
Mermaid code
radar-beta
    title Three products compared
    axis f["Features"], u["Ease of use"], p["Performance"], c["Price"], s["Support"], e["Integrations"]
    curve ours["Our product"]{80, 90, 70, 85, 75, 60}
    curve a["Competitor A"]{90, 65, 85, 55, 80, 90}
    curve b["Competitor B"]{60, 80, 60, 95, 55, 50}
    max 100
    min 0
    ticks 5
Ask an AI for one with this structure
Send the prompt below to ChatGPT or Claude, then paste the whole reply into the editor; the code inside is detected automatically.
Draw a product comparison radar chart with Mermaid radar-beta syntax. Write radar-beta on the first line; define six axes on one axis line: features, ease of use, performance, price, support and integrations; write one curve line per product as curve id["Product name"]{six scores from 0 to 100}; end with max 100, min 0 and ticks 5. Output only the mermaid code block.FAQ
- How do I include a measure where lower is better, such as price?
A radar chart reads outward as better, so convert price to a score first, for example 100 for the cheapest and 50 for the most expensive, and note in the caption that the price axis is a score where higher means better value.
- Where do the scores come from?
Use data that can be checked where possible: feature coverage counts, load test results, public pricing and satisfaction surveys. Subjective scores are fine too, as long as the report says who gave them and on what basis.
- Three overlapping lines are hard to read. What can I do?
Switch to a theme with stronger contrast, or compare two products at a time. You can also export an SVG and enlarge it on a slide without losing sharpness.
More in this category
Updated 2026-11-11