Ready-made radar chart templates
Open one for the preview and the full code, and download PNG, SVG, Word or PowerPoint right there; “Open in the editor” lets you edit the text and pick a theme before exporting.
Three steps to a finished chart
- 1Click "Open the example and edit it" above, or open the template closest to your axes in the editor
- 2Change the axis names and the scores for each series in the code; add a curve line for another series. Or send the prompt below to an AI assistant with your axes and data and paste its whole reply
- 3Pick a theme, then choose Export to Word or Export to PowerPoint; when the data changes, edit a few numbers and export again
How to write a radar chart in Mermaid
Try it: copy this and paste it into the editor to render it.
mermaid
radar-beta
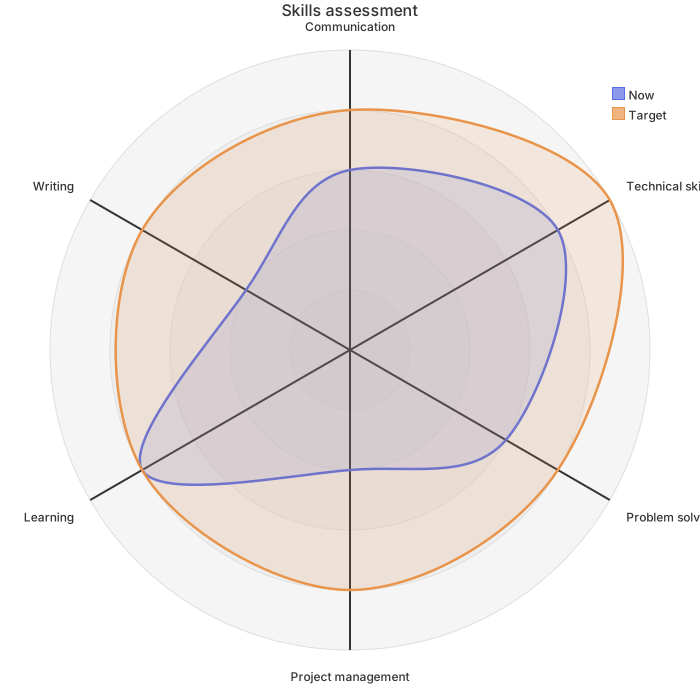
    title Skills assessment
    axis a["Communication"], b["Technical skills"], c["Problem solving"], d["Project management"], e["Learning"], f["Writing"]
    curve now["Now"]{3, 4, 3, 2, 4, 2}
    curve goal["Target"]{4, 5, 4, 4, 4, 4}
    max 5
min 0- Start with radar-beta. One axis line defines every axis: axis a["Communication"], b["Coding"], c["Design"]; the text in brackets is the label
- A curve line is one data series: curve x["Now"]{3, 4, 2}. The numbers follow the order of the axes and there must be one per axis
- max 5 and min 0 set the scale; without max the largest value in the data is used. ticks 5 sets the number of rings
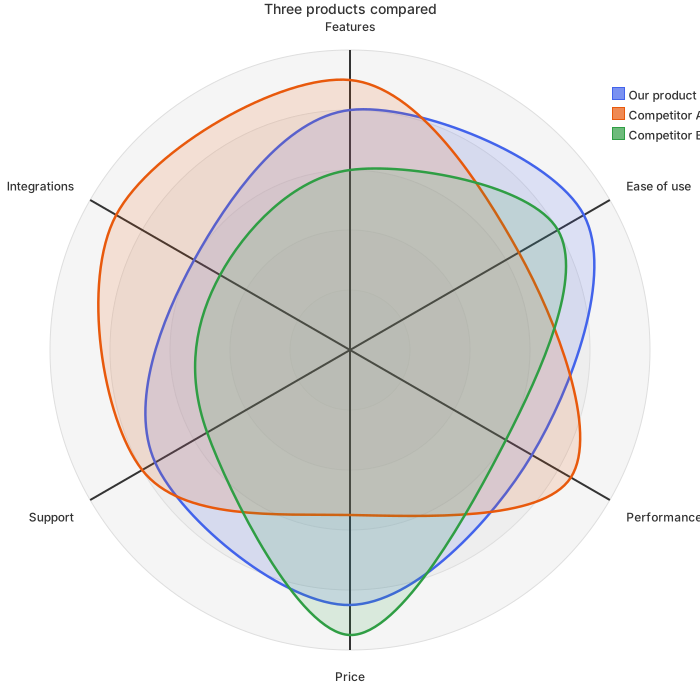
- More curve lines overlay more series, and the legend is generated for you; graticule polygon swaps the circular grid for a polygon
Ask an AI for your own version with this structure
Send the prompt below to ChatGPT or Claude with the parts in [brackets] replaced by yours, then paste the whole reply into the editor; the code inside is detected automatically.
prompt.txt
Draw a radar chart with Mermaid radar-beta syntax. The subject is [skills assessment] and the axes are: [communication, technical skills, problem solving, project management, learning, writing]. Write radar-beta on the first line; define every axis on one axis line as axis a["Axis one"], b["Axis two"], ...; write one curve line per data series as curve id["Label"]{number, number, ...} with one number per axis. The data is: [now: 3, 4, 3, 2, 4, 2; target: 4, 5, 4, 4, 4, 4] on a scale of 5, so add max 5 and min 0. Output only the mermaid code block.Frequently asked questions
- What kind of data suits a radar chart?
- One subject measured on four to eight dimensions, or two or three subjects compared on the same dimensions: a skills assessment, a feature comparison or a team review. The dimensions need a common scale, so convert them to the same range first.
- How many series can a radar chart hold?
- Keep it to three or fewer. Beyond that the polygons cover each other; a grouped bar chart or several radar charts reads better.
- My dimensions have different maximum scores. What should I do?
- All axes on a radar chart share one scale, so convert the data to the same range first, such as 0 to 5 or 0 to 100, put those values in the curve lines and state the top of the scale with max.
- Why is the first line radar-beta? Can I write radar?
- Mermaid names this chart radar-beta; -beta means it is still being refined. A first line of just radar is not recognized, and the editor offers a one-click change to radar-beta.
- Excel draws radar charts too. What is different here?
- Excel fits data that already lives in a sheet. Here a few lines of text describe the axes and data, which suits charts generated by an AI assistant and edited later; the exported Word and PowerPoint files carry the code, so changing a number needs no re-layout.