When to use it
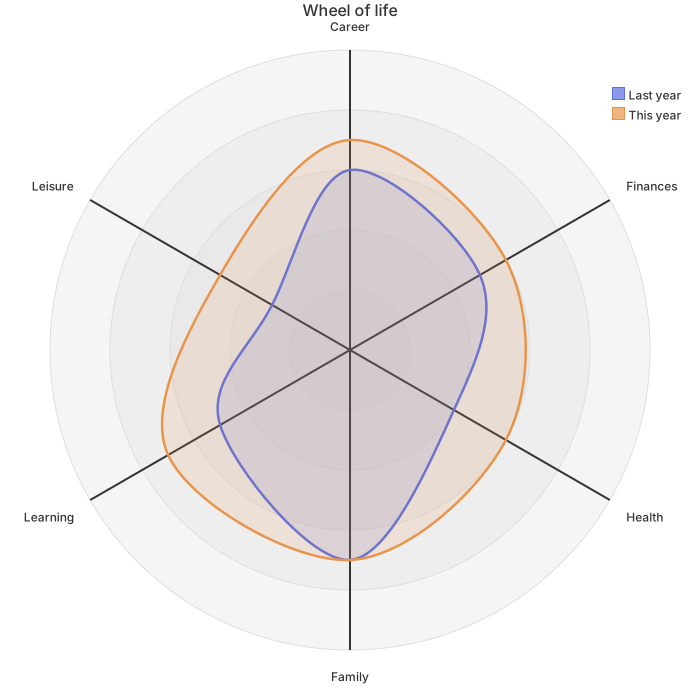
Use it when you write end-of-term comments, show families a term's change at a conference, or help a student build a portfolio. With two curves on one chart, where the student has grown and where they still need support is easier to see than in a row of scores.
Make it yours
- Change the dimensions to those in your school's framework by editing the quoted text in
axis. - The numbers in braces follow the order of the dimensions, and there must be one per dimension.
- Compare one student over time; comparing two students on one chart is not a good idea.
- If your scale does not top out at 5, change the number after
max.
Mermaid code
radar-beta
    title Student progress
    axis a["Academics"], b["Reasoning"], c["Collaboration"], d["Communication"], e["Creativity"], f["Wellbeing"]
    curve start["Start of term"]{4, 3, 3, 2, 3, 2}
    curve finish["End of term"]{4, 4, 4, 3, 4, 3}
    max 5
    min 0
Ask an AI for one with this structure
Send the prompt below to ChatGPT or Claude, then paste the whole reply into the editor; the code inside is detected automatically.
Draw a student progress radar chart with Mermaid radar-beta syntax. The title is Student progress, and the axes are Academics, Reasoning, Collaboration, Communication, Creativity and Wellbeing. Add two curves, Start of term and End of term, each with six scores from 0 to 5, plus max 5 and min 0. Output only the mermaid code block.
FAQ
- Where do the scores come from?
From the levels or rubric in your school's framework, converted to numbers, such as exceeding 5 and meeting 4.
- Can I make one for every student in a class?
Yes. Copy the code, change the numbers and export each chart. Members can use batch export to pack many charts into one archive.
- Is student data uploaded?
Drawing and exporting happen in the browser and the content is not uploaded. Leave full names off any chart you share publicly.
More in this category
Updated 2026-11-11