When to use it
Quality reports, 8D reports, improvement team sessions and production reviews. The head is the problem to analyze, and the six main bones are the categories often used in manufacturing: people, machines, materials, methods, environment and measurement. Each one lists the specific causes raised on the floor.
Make it yours
- Change the second line to your problem; a measurable symptom works best, such as "First-pass yield below 95%".
- Write one cause per line under a category, indented one level deeper; delete any category you do not need.
- To keep asking why, indent one more level under a cause and write the finer cause.
- Indent with spaces only and keep lines on the same level aligned.
Mermaid code
ishikawa-beta
    High product defect rate
    People
        New operators lack training
        Work instructions not followed
    Machines
        Aging equipment loses precision
        Maintenance overdue
    Materials
        Large variation between batches
        Loose supplier inspection
    Methods
        Process parameters not fixed
        First-article check skipped
    Environment
        Temperature and humidity swings
        Cluttered material staging
    Measurement
        Gauges not calibrated on time
        Inconsistent inspection criteria
Ask an AI for one with this structure
Send the prompt below to ChatGPT or Claude, then paste the whole reply into the editor; the code inside is detected automatically.
Draw a fishbone diagram with Mermaid ishikawa-beta syntax that analyzes the causes of a high product defect rate. Write ishikawa-beta on the first line and the problem, indented, on the second. Below it add one line each for People, Machines, Materials, Methods, Environment and Measurement, and two specific causes indented one level deeper under each. Indent with spaces only and write plain text on each line. Output only the mermaid code block.
FAQ
- Do I have to use these six categories?
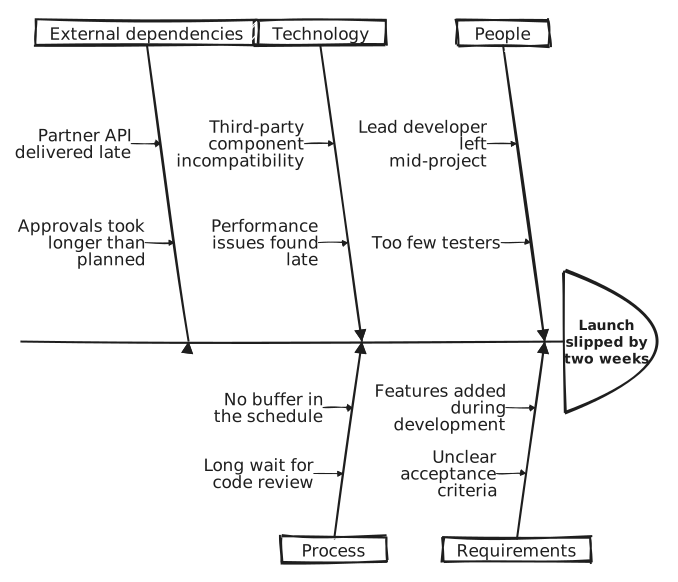
No. They are a manufacturing habit. Services often use people, process, policy and place, and software projects can use people, requirements, technology, process and environment. Categories exist to prompt the team to look from different angles, so swap them for your context.
- How detailed should a cause be?
Detailed enough to act on. "Lack of training" still invites another why, while "No hands-on check before new operators start" maps straight to an improvement. Keep two or three levels on the diagram and put finer detail in the report.
- What comes after listing the causes?
Rank the causes by impact and frequency, circle the top two or three, confirm them with data and then decide on actions. A fishbone diagram lists the possible causes; it does not decide which one is the root cause.
More in this category
Updated 2026-11-11